
Throughput testing for an IoT data platform
Proved stable ingestion throughput and latency at over a million device messages an hour, so the platform could onboard new fleets with confidence.
1M+ msgs/hour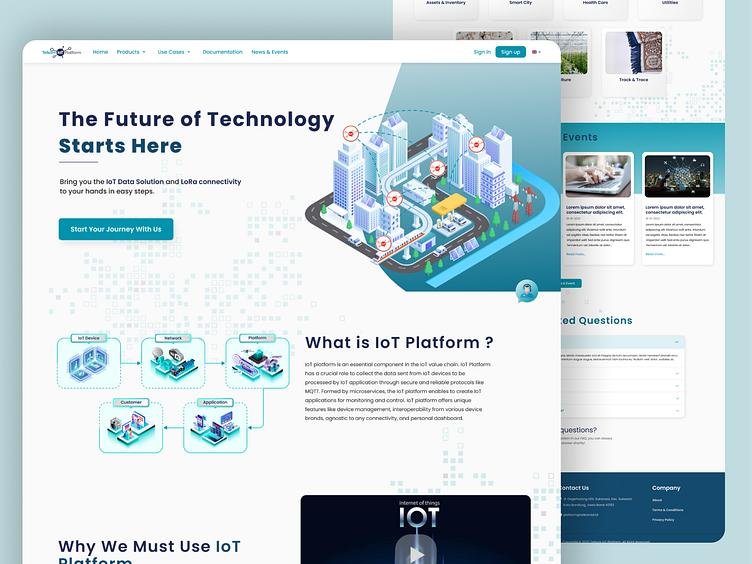
Problem, approach, and the outcome
The client operates an industrial IoT platform that ingests telemetry from sensors across manufacturing sites and surfaces it on real-time monitoring dashboards. On a factory floor, the value of that data collapses the moment it stops being current.
The business was signing on larger customers with far bigger device fleets, and needed to know the ingestion tier would keep up rather than quietly falling behind under the new volume.
The platform had grown organically and had never been tested at the message volumes its newest customers would generate. Each contract raised the ceiling without anyone confirming the platform could reach it.
High-volume ingestion has a particular failure mode: rather than crashing outright, the pipeline silently lags, and dashboards drift minutes behind reality while still appearing to work. For a real-time monitoring product, stale data that looks live is the worst outcome of all.
The team needed proof that both throughput and end-to-end latency stayed stable at target volume, not just that the system stayed up. Freshness was the metric that actually mattered.
We built device-simulation load in k6 and JMeter that reproduced realistic ingestion patterns, bursty publishes, steady streams, and reconnect storms, and drove the pipeline well past a million messages an hour. Simulating real device behaviour is what makes the throughput figure meaningful.
We measured end-to-end latency, not just request success, so we could prove data reached the dashboards fresh rather than merely being accepted at the edge. Tracking freshness is what catches the silent-lag failure mode.
InfluxDB and Grafana tracked ingestion rate, queue depth, and latency percentiles throughout, letting us confirm the pipeline held steady rather than slowly degrading over a sustained run. We handed the team a repeatable throughput benchmark to re-run as fleets grow. The platform could now onboard large customers on evidence.
- Stable ingestion proven beyond 1M+ messages an hour
- End-to-end latency held, ruling out silent dashboard lag
- Queue depth and throughput tracked across a sustained run
- Repeatable throughput benchmark handed to the team
More Quality Assurance & Testing case studies
Load and soak testing for an enterprise cloud platform
Validated a 99.9% uptime SLA under peak load, so the cloud portal and provisioning APIs held through demand spikes without incident.
Read the full case study
Checkout stress and spike testing for a merchant platform
Isolated the true checkout bottleneck and produced a validated capacity model showing three times the throughput headroom the platform believed it had.
Read the full case study
Scalability and endurance testing for an analytics platform
Kept p95 latency flat as audience data and concurrency scaled, proving the analytics dashboards would not slow as customers grew.
Read the full case studyGet a senior architect on the call, first time, every time.
No SDR gauntlet. 30 minutes with an engineer who can scope the problem, name the risks, and give you an honest feasibility call.