
Live yield analytics dashboard for a DeFi asset manager
Indexed on-chain positions across more than 40 pools in real time, giving a DeFi asset manager one live view of where yield was actually moving.
40+ pools tracked live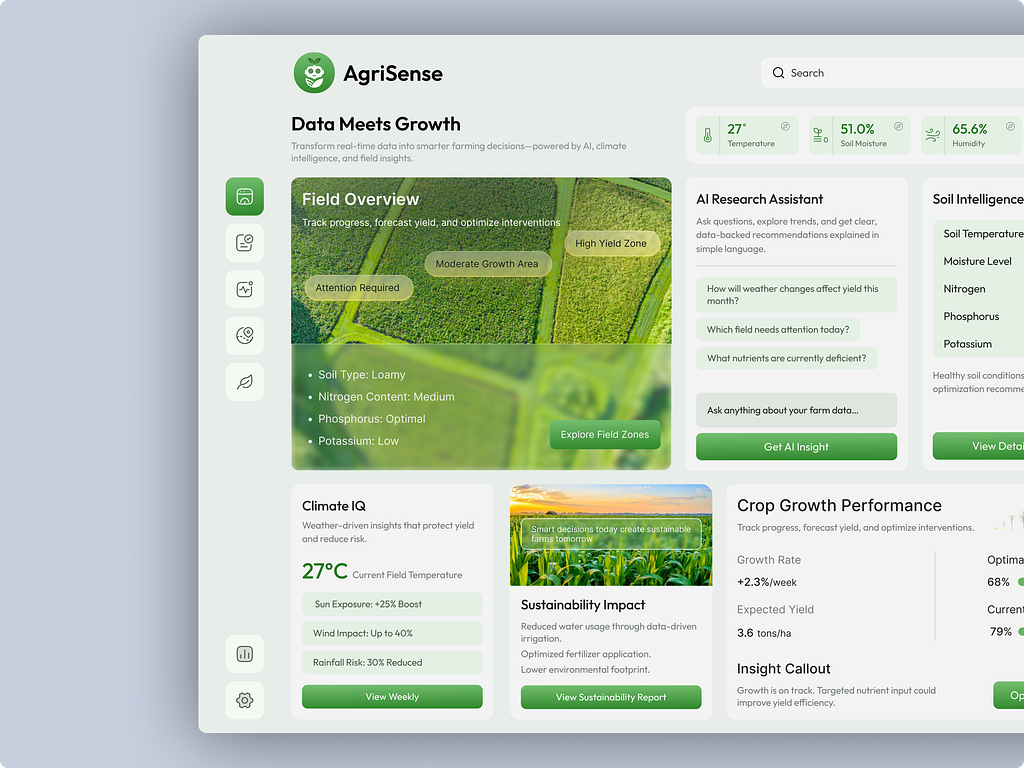
Problem, approach, and the outcome
The client is a UK digital-asset manager running yield strategies across dozens of lending markets, vaults and liquidity pools on behalf of its clients. For a manager, allocation decisions are only as good as the position data behind them.
Their view of that data was stitched together from block explorers, spreadsheets and a handful of protocol front-ends, so nobody could see the whole book at once.
Positions were spread across dozens of protocols, each with its own interface and its own way of reporting APY, TVL and utilisation. Assembling a single picture meant hours of manual reconciliation that was stale the moment it finished.
Because the numbers lagged reality, the team was allocating on yesterday's yields while opportunities and risks shifted underneath them. In a fast-moving market that lag has a direct cost.
The manager needed a live, trustworthy dashboard that pulled every position into one place. A current, joined-up view was the prerequisite for acting with any confidence.
We indexed on-chain positions with a subgraph layer, so live APY, TVL and utilisation tiles reflect the chain as it updates rather than a periodic snapshot. Reading state directly from the chain is what keeps the view honest.
We wired price and rate feeds through decentralised oracles, so valuations stayed consistent and manipulation-resistant across every pool. Trustworthy pricing is the foundation of a trustworthy dashboard.
On top we built performance callouts and an AI research assistant that surface where yield is moving and why, so the team reads signal instead of raw tables. The dashboard became a decision tool, not just a reporting screen.
- 40+ pools indexed and tracked live
- One real-time view of APY, TVL and utilisation
- Oracle-fed pricing consistent across every position
- Yield movements surfaced as callouts, not raw tables
More Blockchain case studies
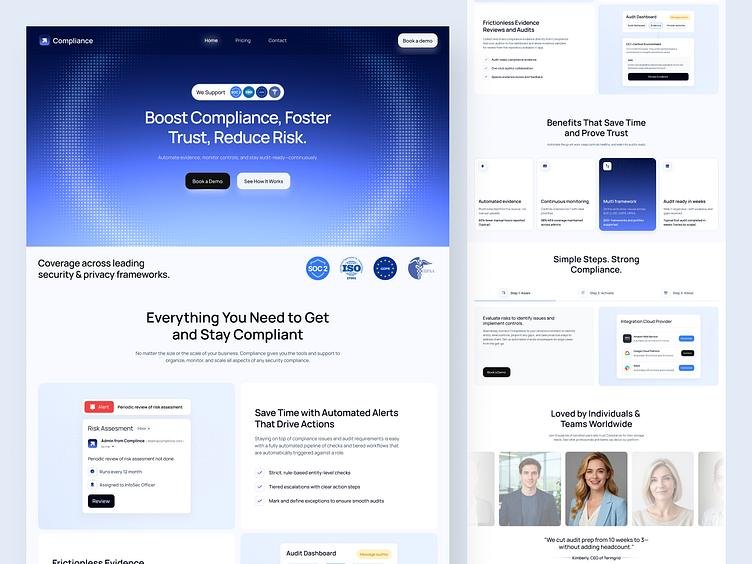
On-chain compliance and audit-readiness platform for a protocol
Automated evidence collection and continuous monitoring got a protocol audit-ready in weeks rather than months, with a complete controls trail behind every review.
Read the full case study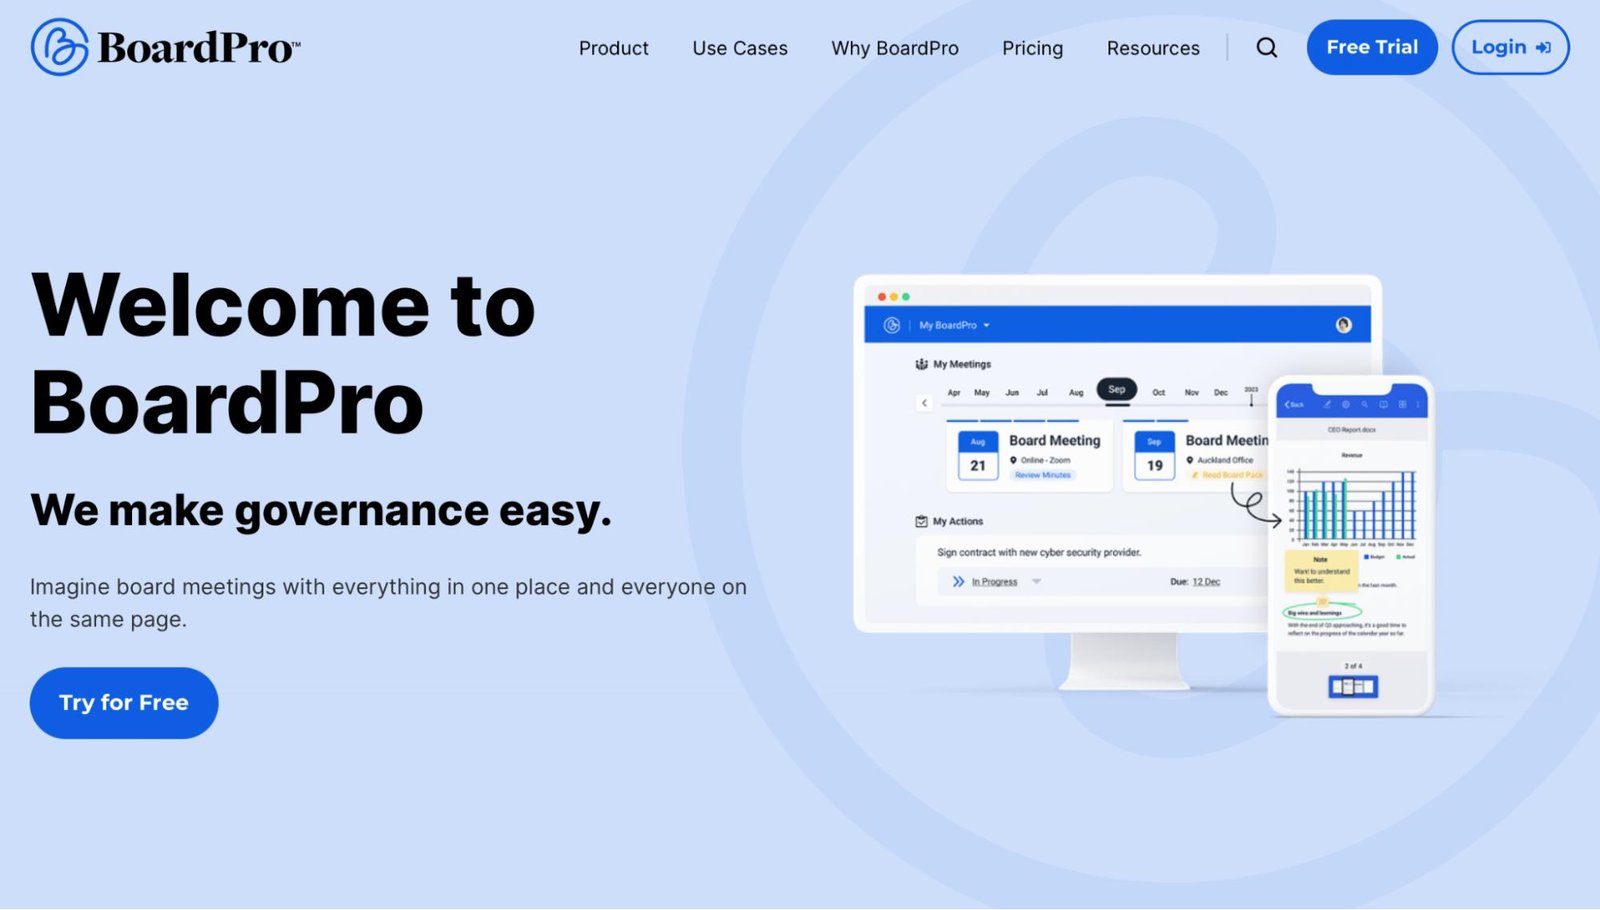
DAO governance portal for a Web3 organisation
Wired the proposal-to-execution lifecycle straight into on-chain voting and treasury actions, tripling the speed of a Web3 organisation's proposal cycles.
Read the full case study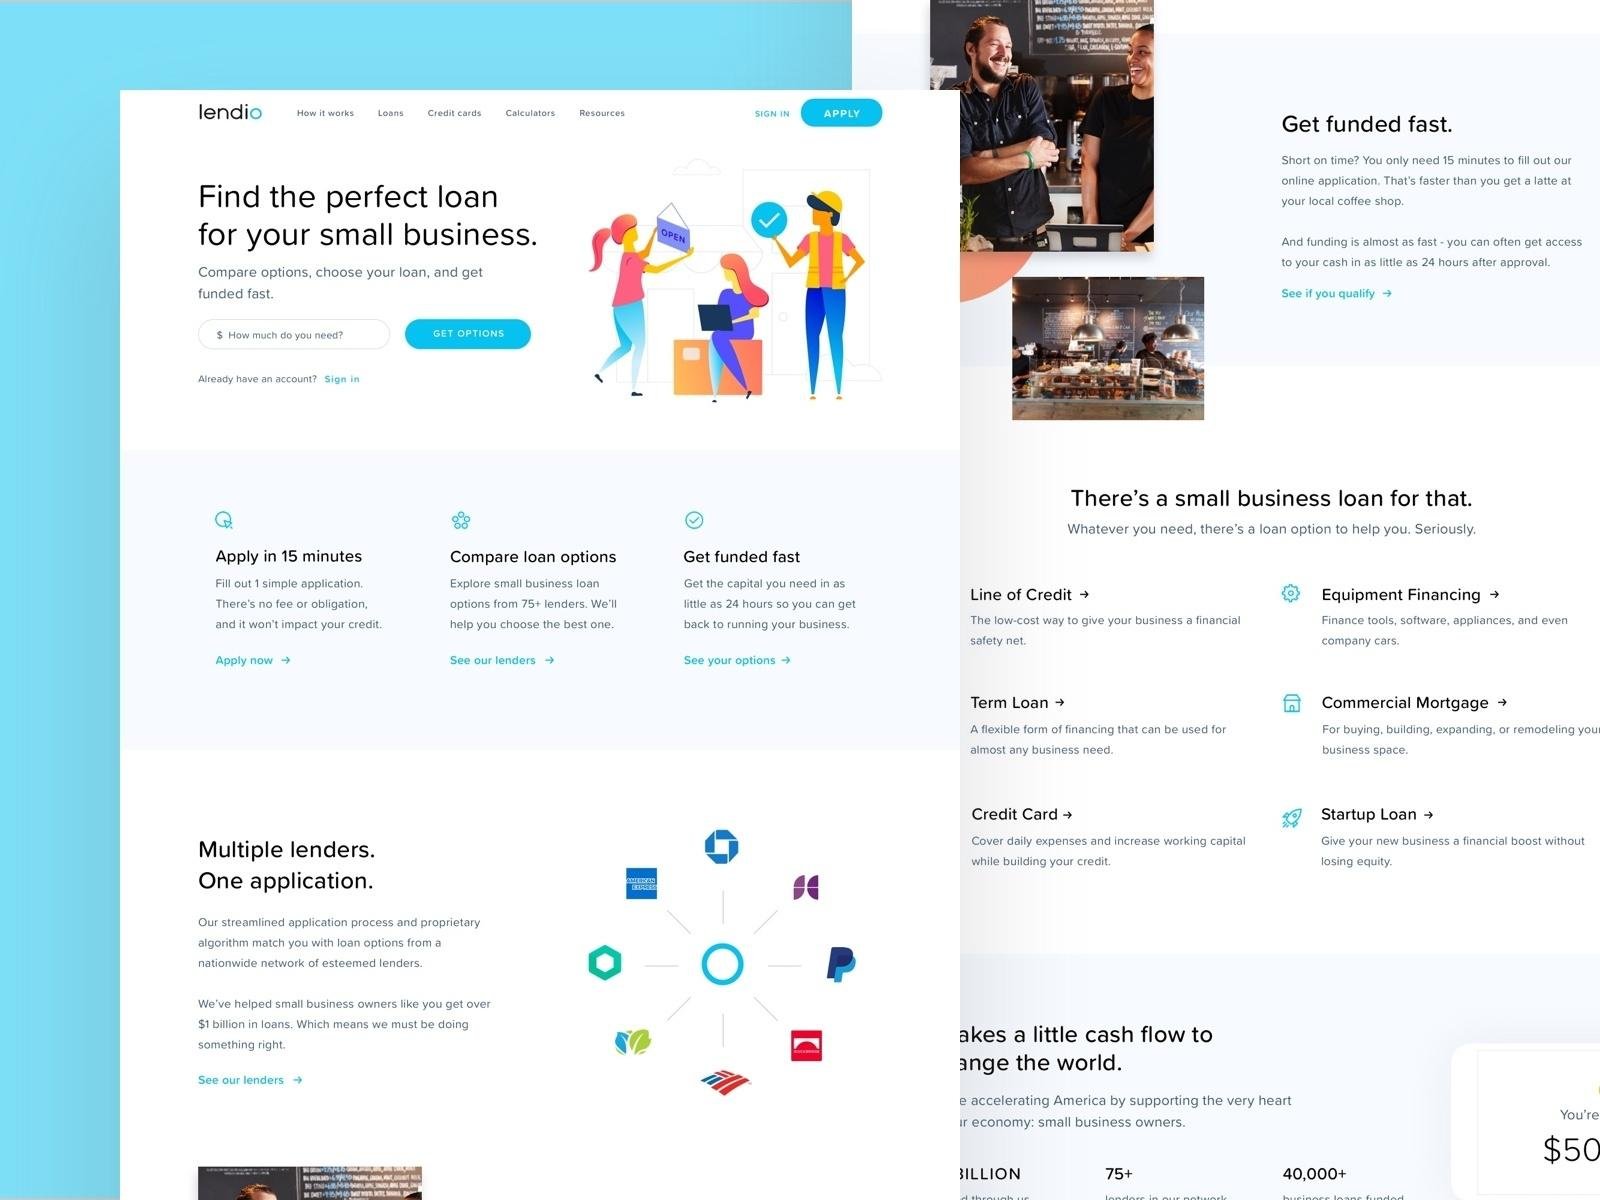
Lending and borrowing marketplace for a DeFi fintech
Matched borrower demand to non-custodial money markets through a single application, routing more than a billion dollars in loans across lines of credit and term loans.
Read the full case studyGet a senior architect on the call, first time, every time.
No SDR gauntlet. 30 minutes with an engineer who can scope the problem, name the risks, and give you an honest feasibility call.